How to see EV adoption around a site
Shade the map by the share of registered vehicles that are EVs and open an area's registrations and forecast.
By the end you will see how common EVs are around a site compared with nearby areas and the national average. Start with the address open on the Evaluate map, as in How to look up an address on the Evaluate map. EV Penetration needs a Pro plan.
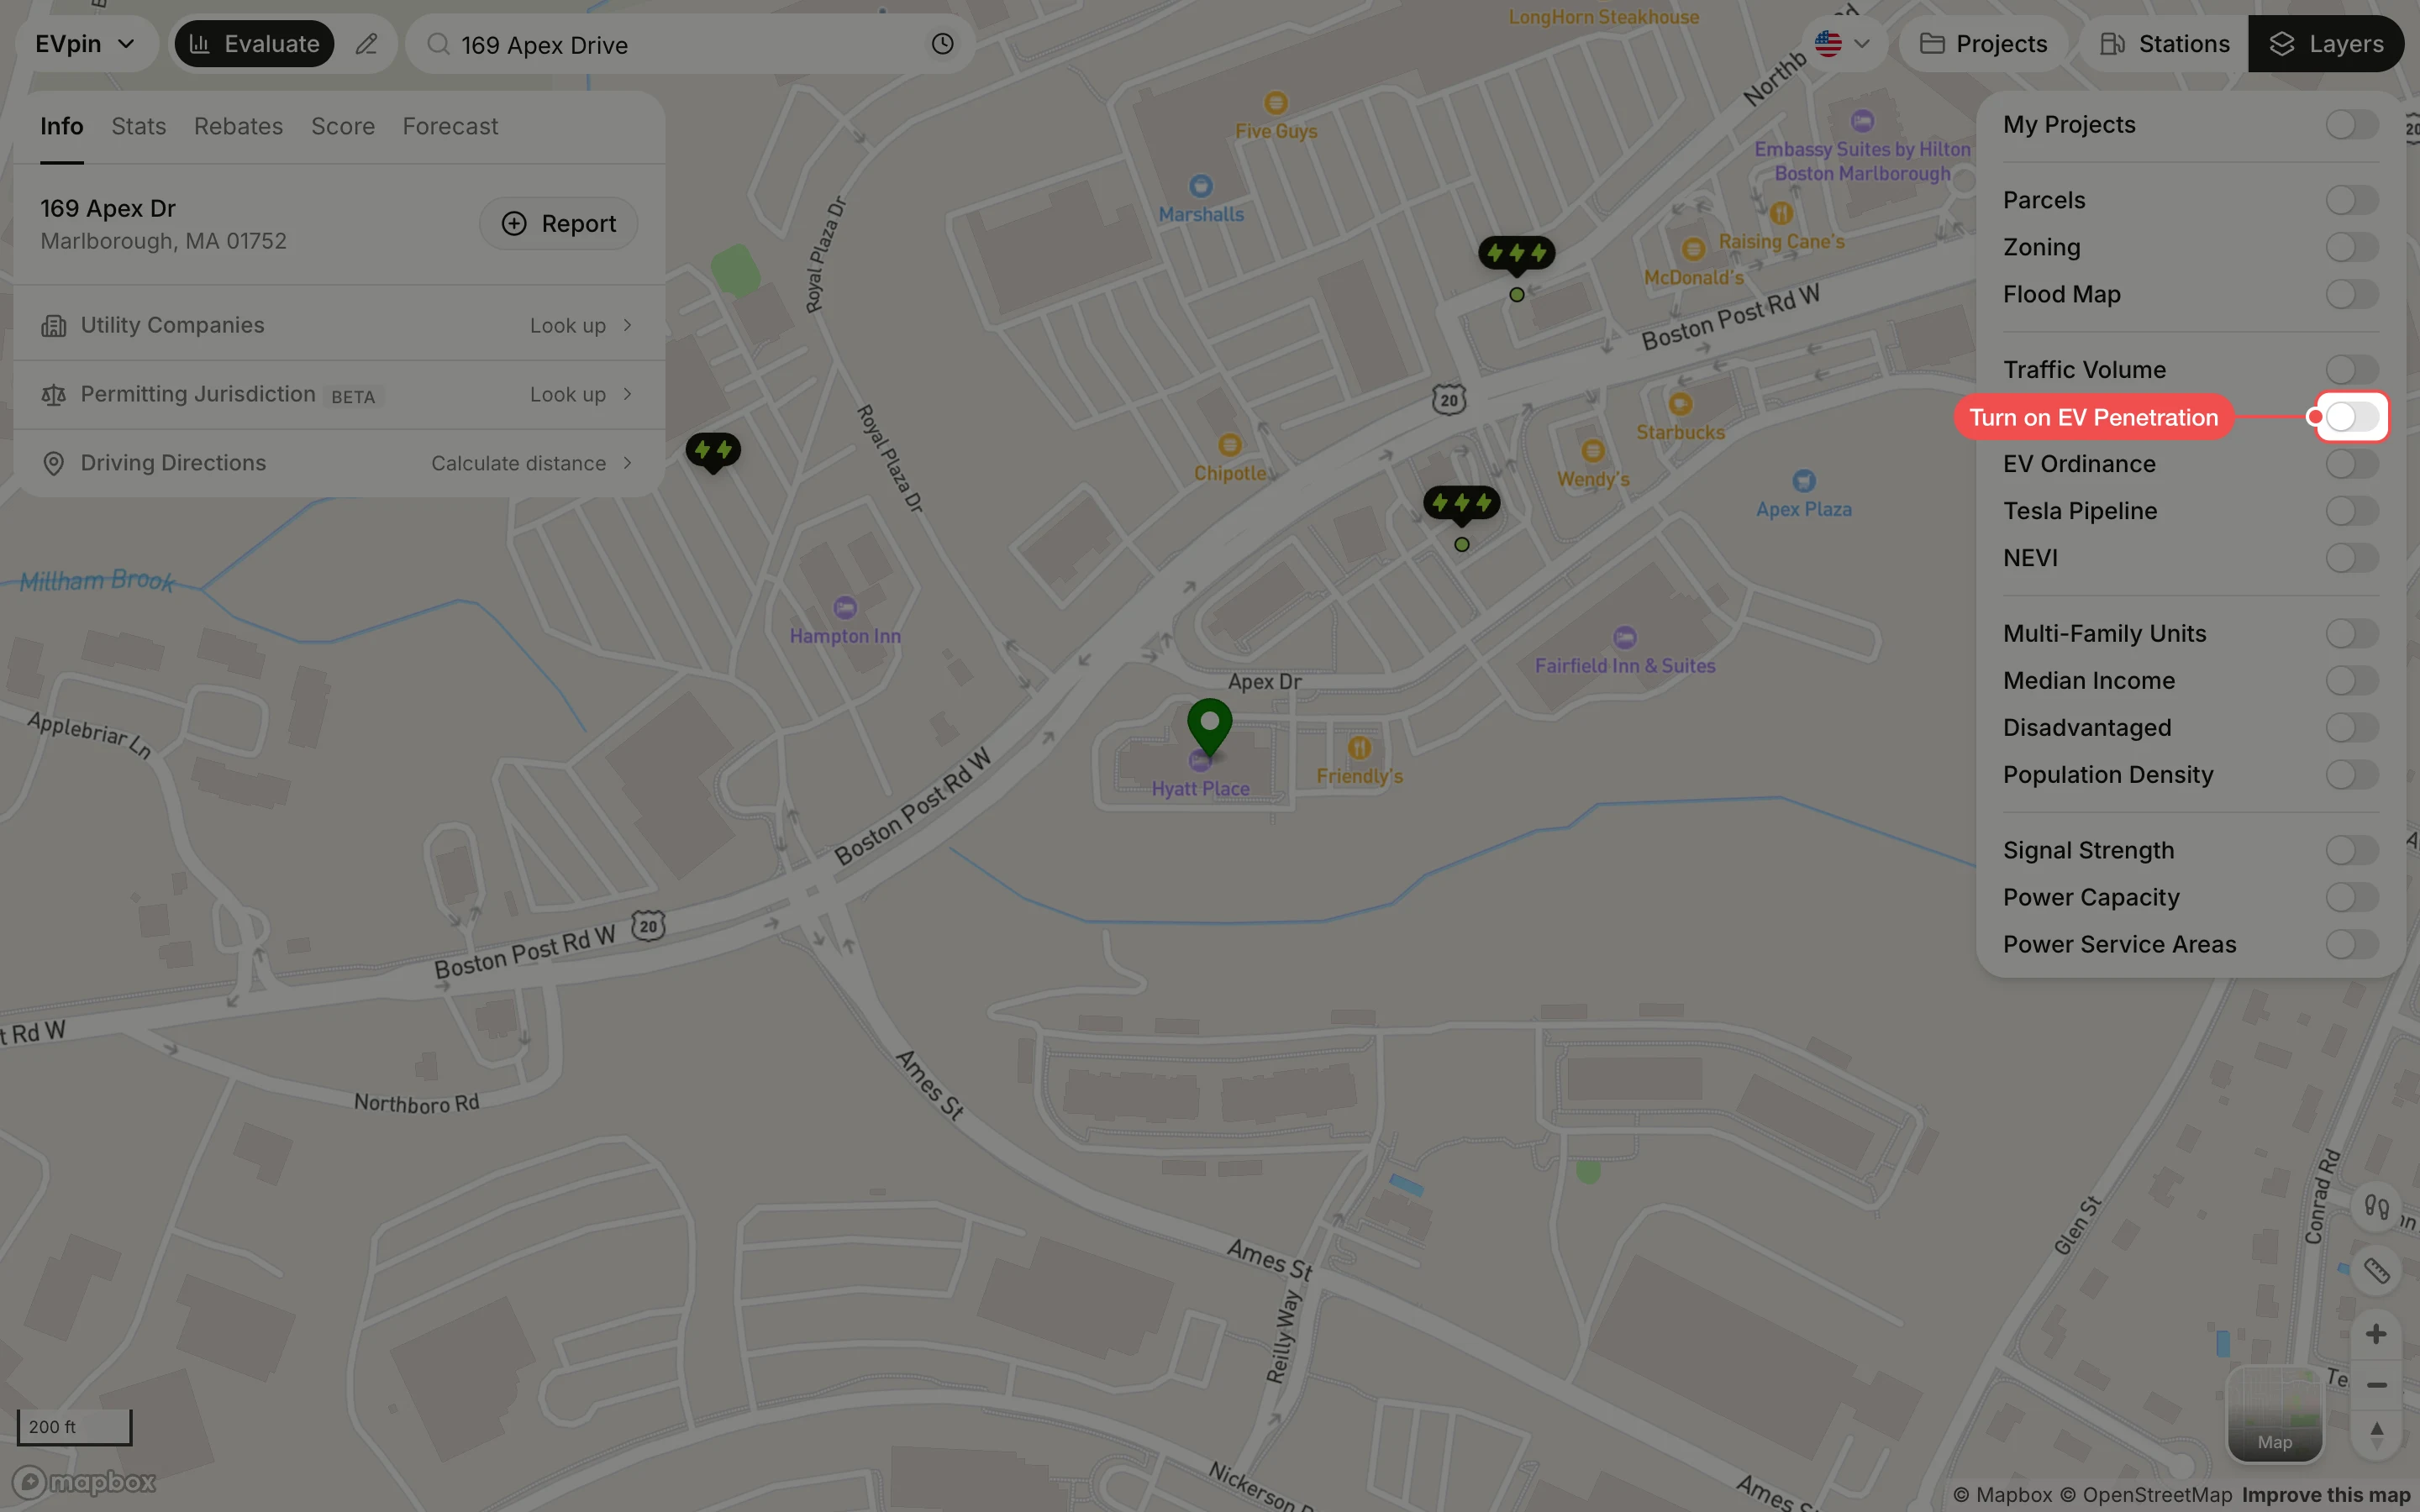
Turn on EV Penetration
In the Layers panel at the top right, turn on EV Penetration. Areas are shaded by the percentage of registered vehicles that are EVs; the legend is at the bottom left.
Click a level
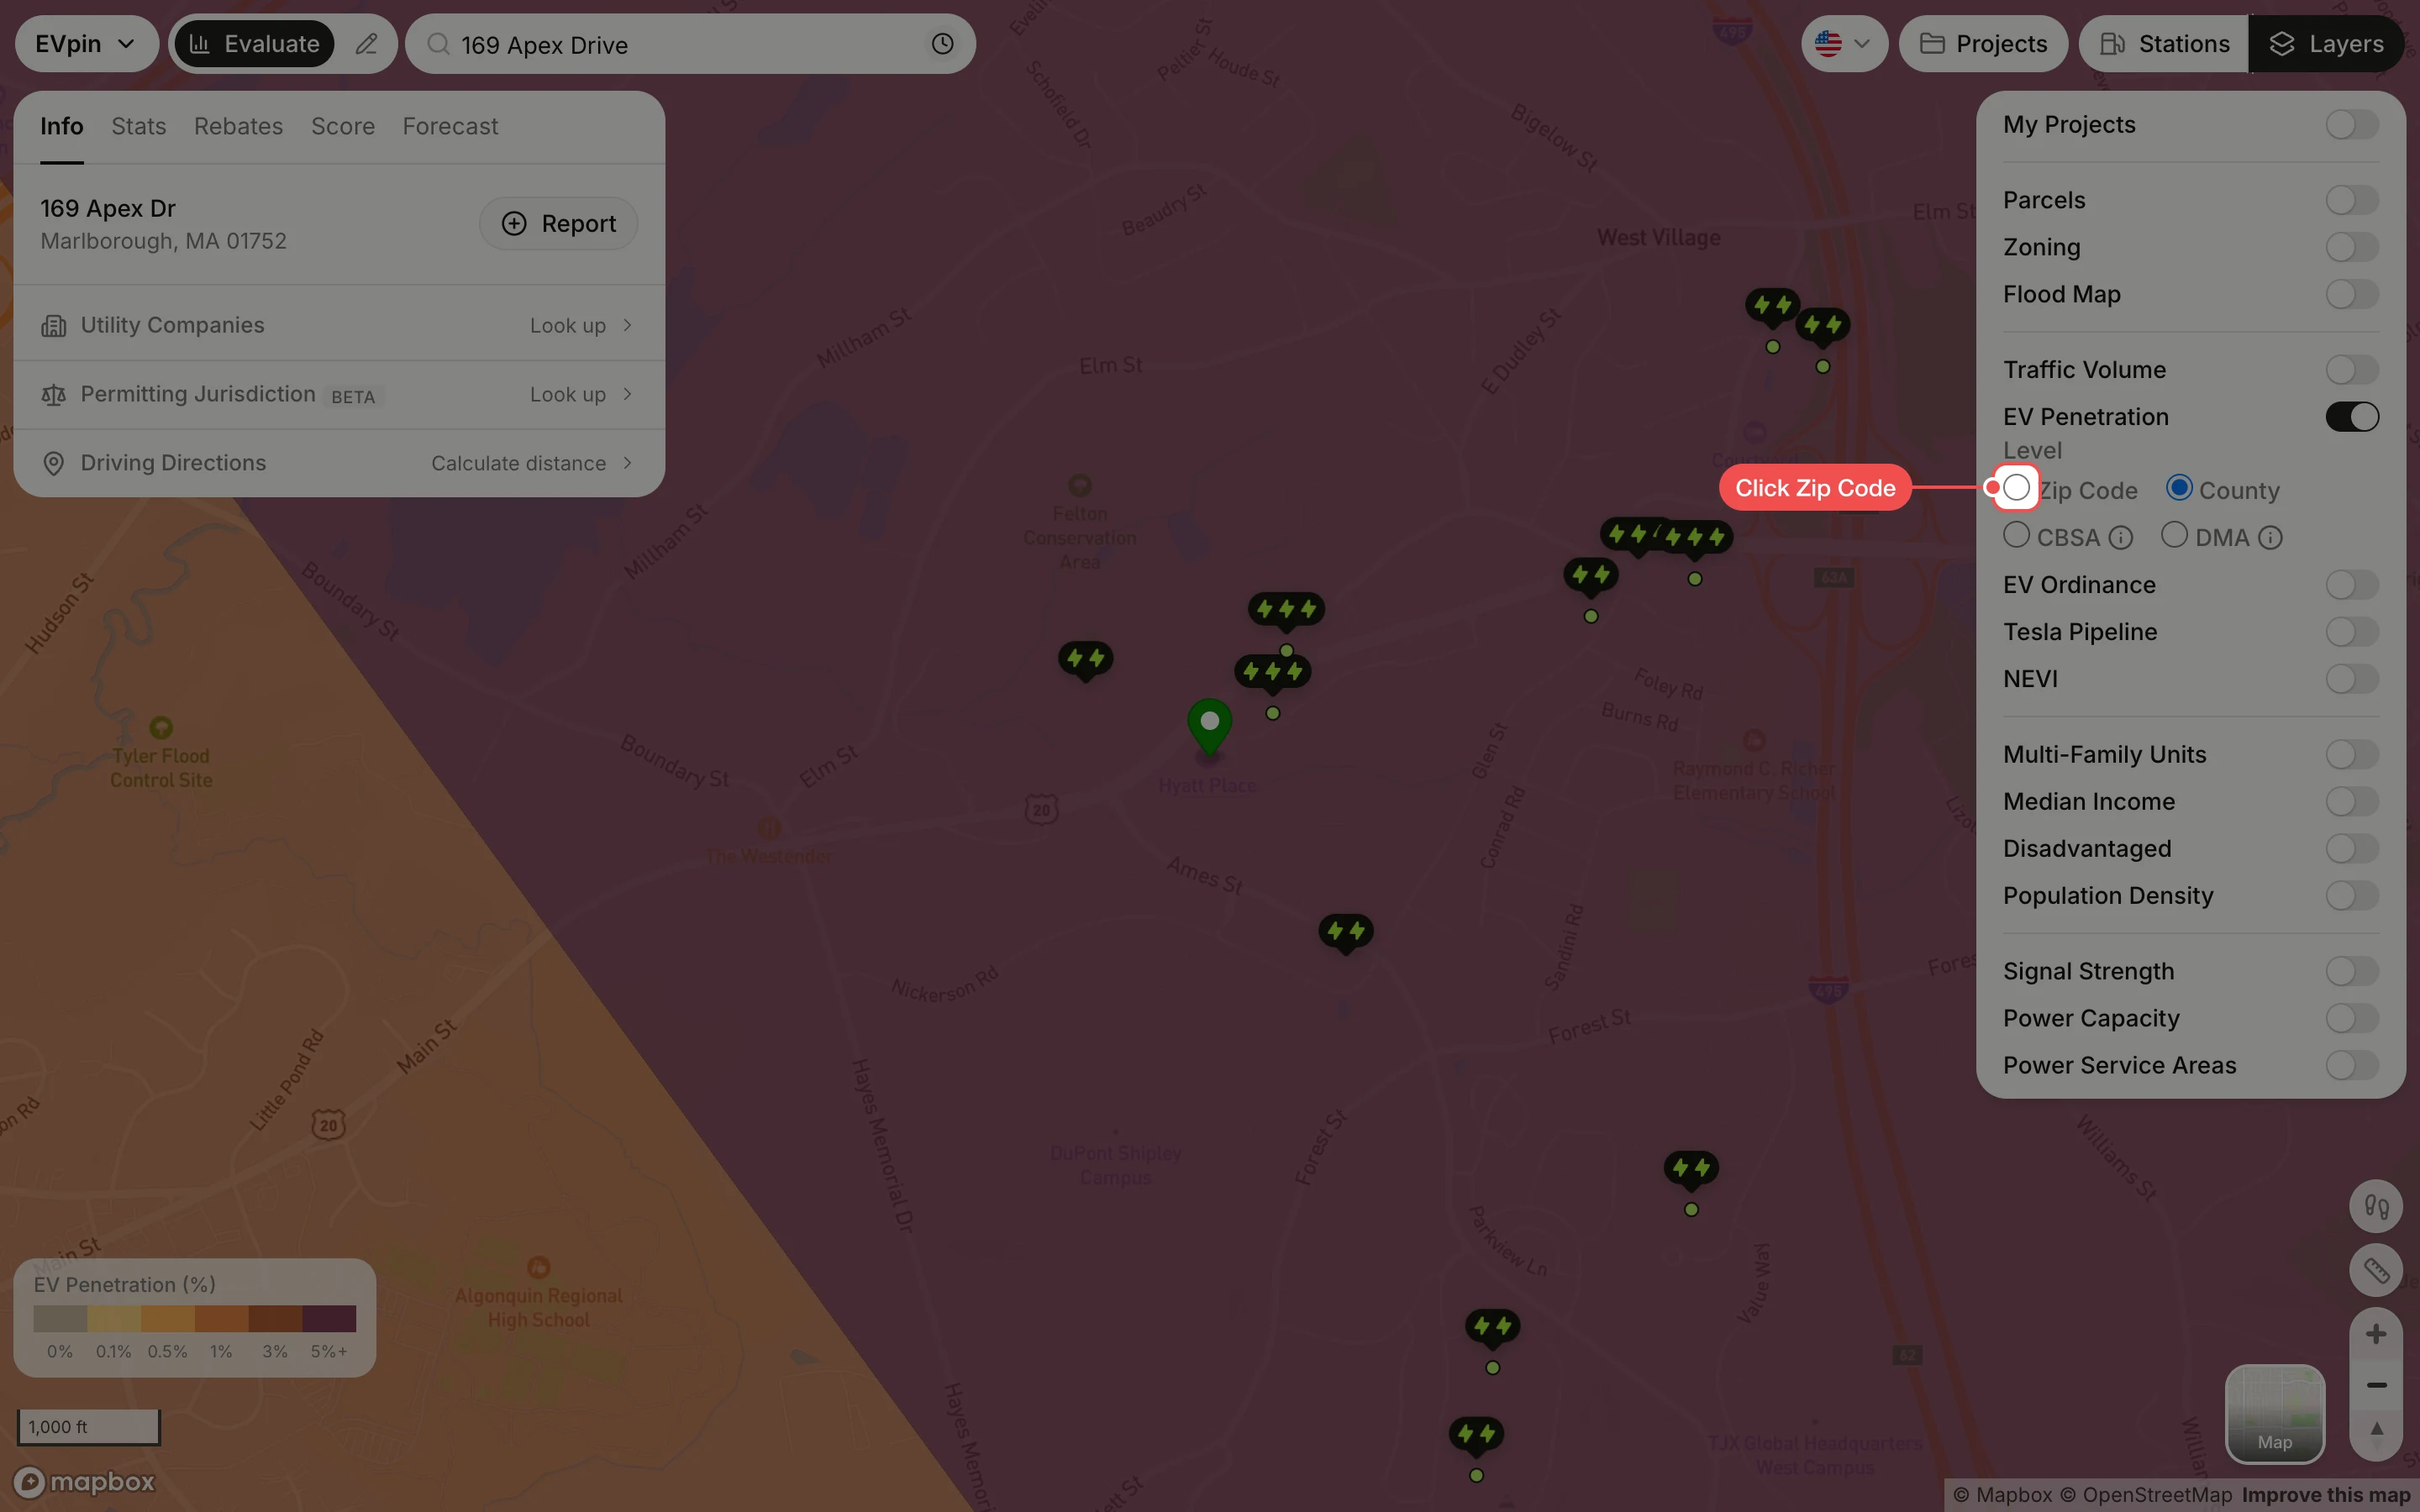
Under Level, click Zip Code for the most local view. County, CBSA (metro area) and DMA (media market) show larger areas.
Click the site's area
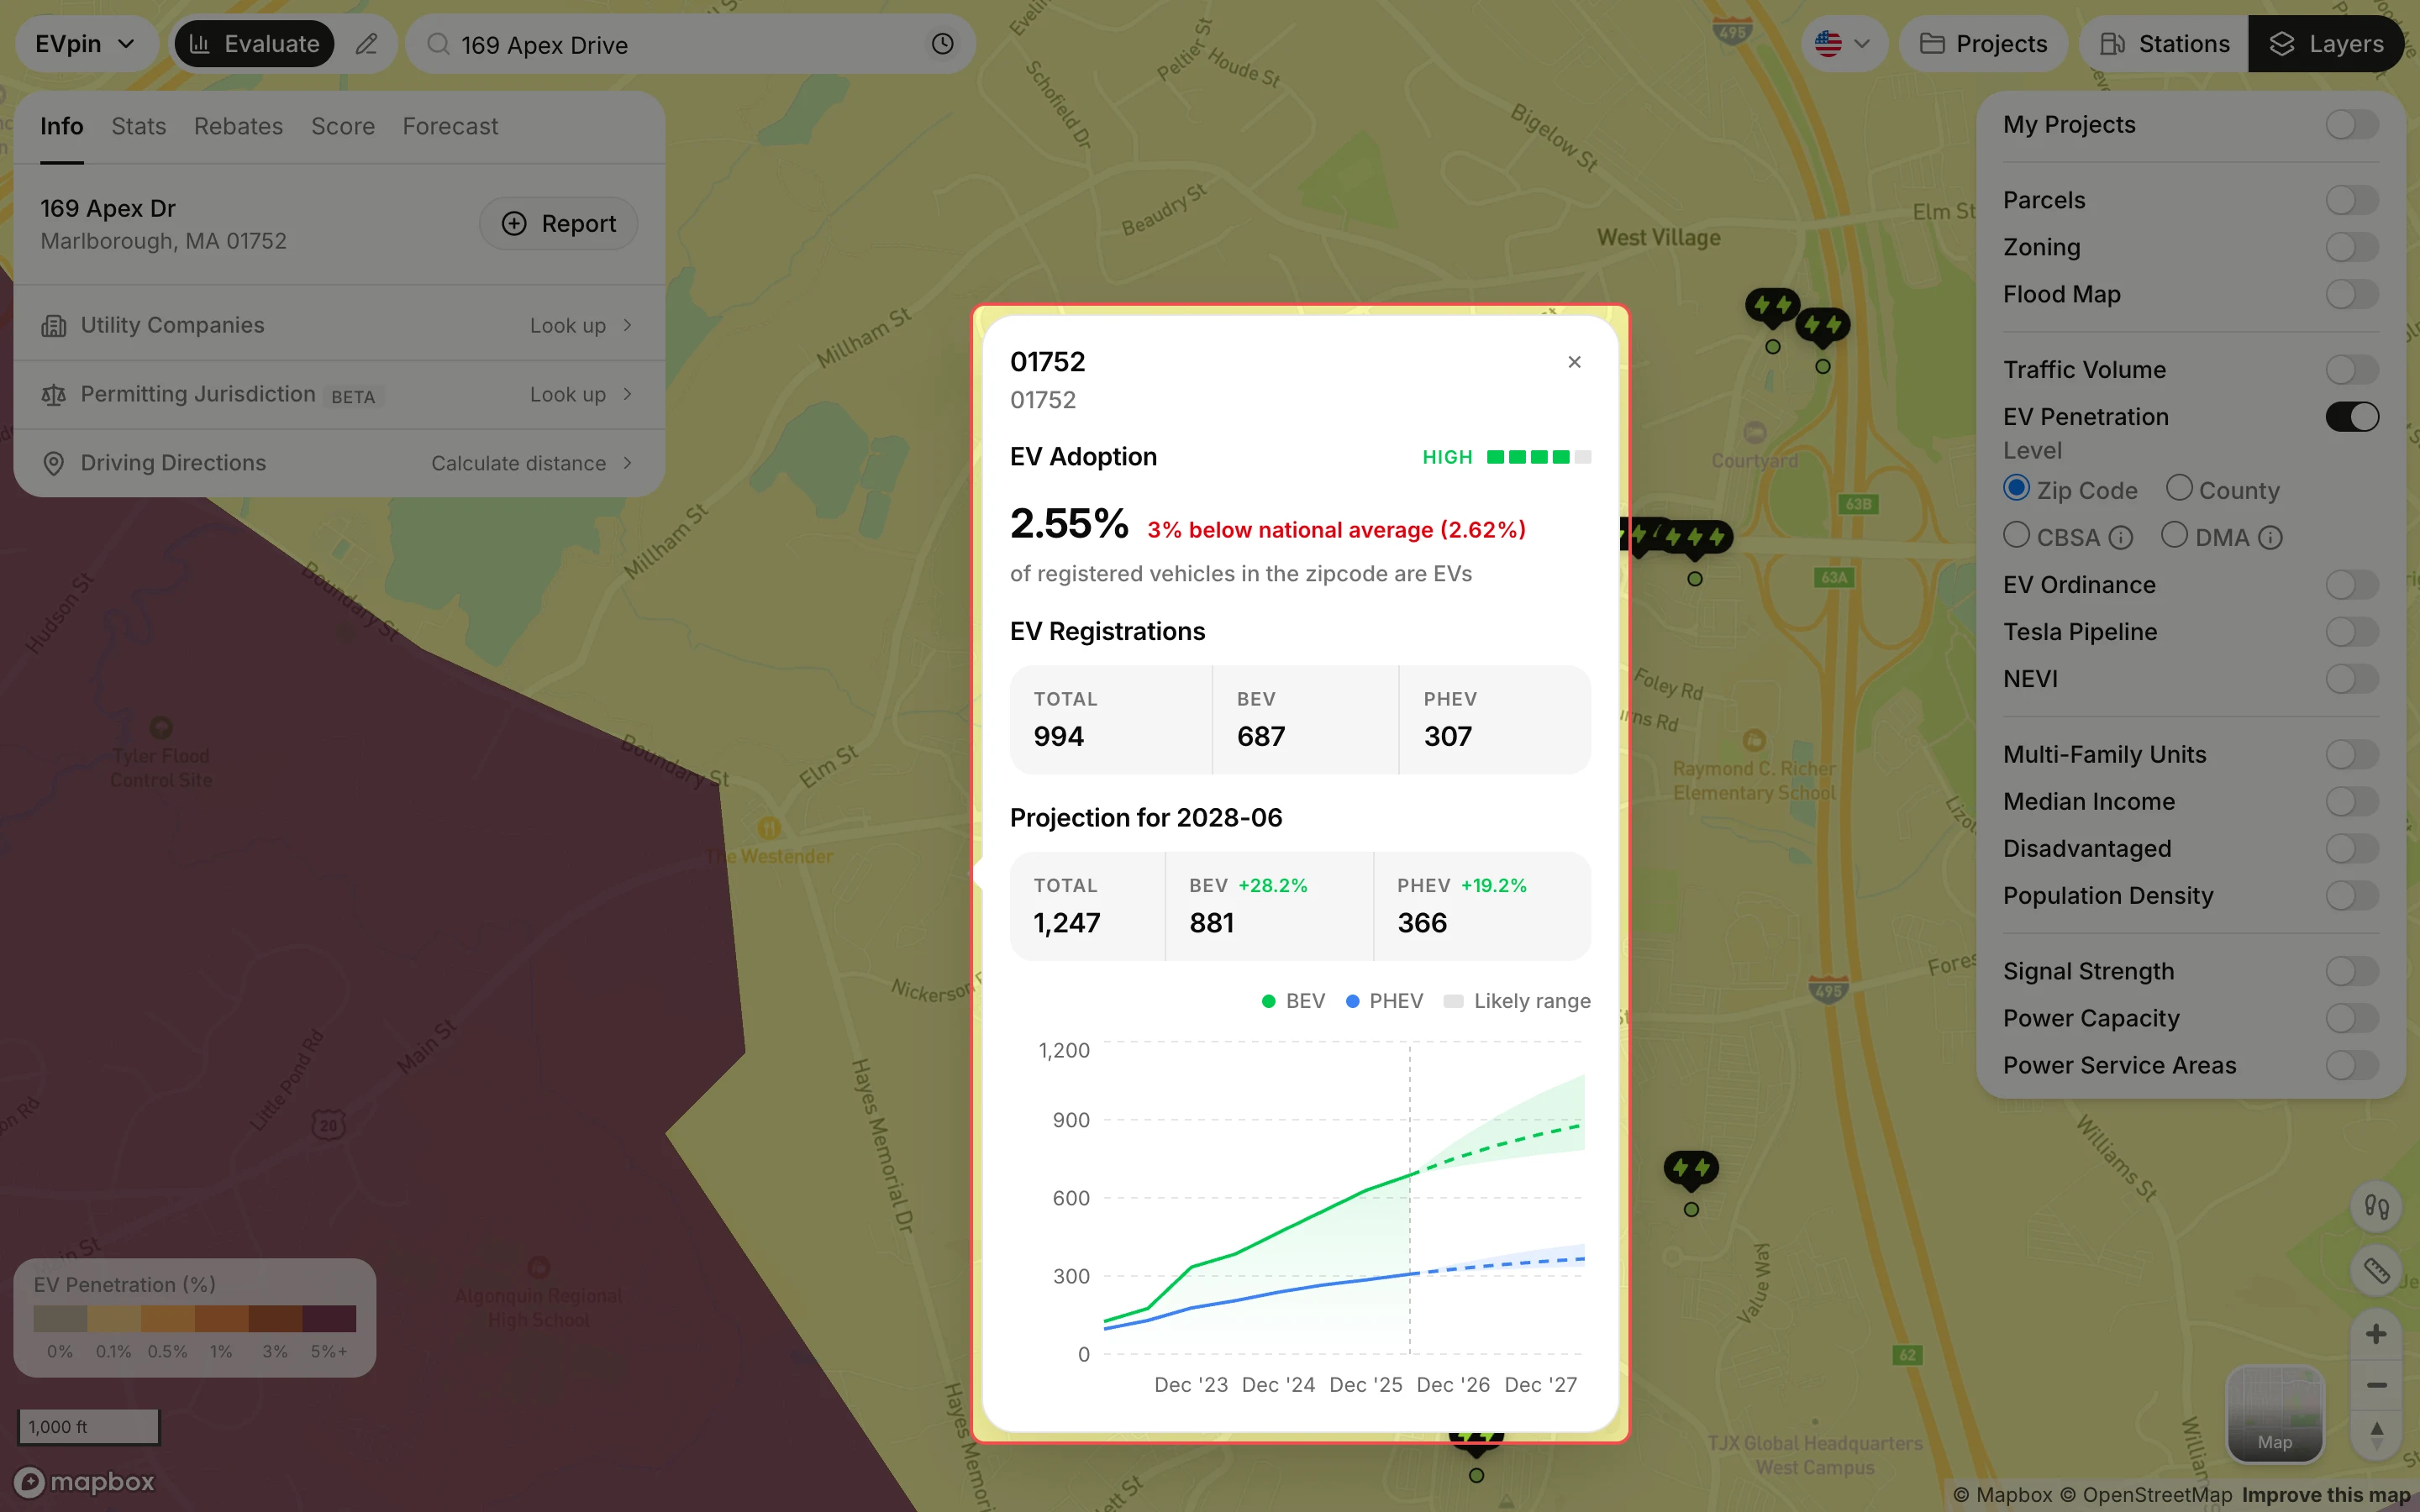
Click the area under the site. The popup gives its EV share against the national average, the number of battery-electric (BEV) and plug-in hybrid (PHEV) registrations, and a projection with its likely range.
What's next
- How to check EV registrations near a site for the counts within a radius of the address.